- Alabama
- Alaska
- Arizona
- Arkansas
- California
- Colorado
- Connecticut
- Delaware
- District of Columbia
- Florida
- Georgia
- Hawaii
- Idaho
- Illinois
- Indiana
- Iowa
- Kansas
- Kentucky
- Louisiana
- Maine
- Maryland
- Massachusetts
- Michigan
- Minnesota
- Mississippi
- Missouri
- Montana
- Nebraska
- Nevada
- New Hampshire
- New Jersey
- New Mexico
- New York
- North Carolina
- North Dakota
- Ohio
- Oklahoma
- Oregon
- Pennsylvania
- Rhode Island
- South Carolina
- South Dakota
- Tennessee
- Texas
- Utah
- Vermont
- Virginia
- Washington
- West Virginia
- Wisconsin
- Wyoming
3 Graphs Showing Why Today’s Housing Market Isn’t Like 2008
Mortgage Standards Were Much More Relaxed Back Then
During the lead-up to the housing crisis, it was much easier to get a home loan than it is today. Running up to 2006, banks were creating artificial demand by lowering lending standards and making it easy for just about anyone to qualify for a home loan or refinance their current home.
Back then, lending institutions took on much greater risk in both the person and the mortgage products offered. That led to mass defaults, foreclosures, and falling prices. Today, things are different, and purchasers face much higher standards from mortgage companies.
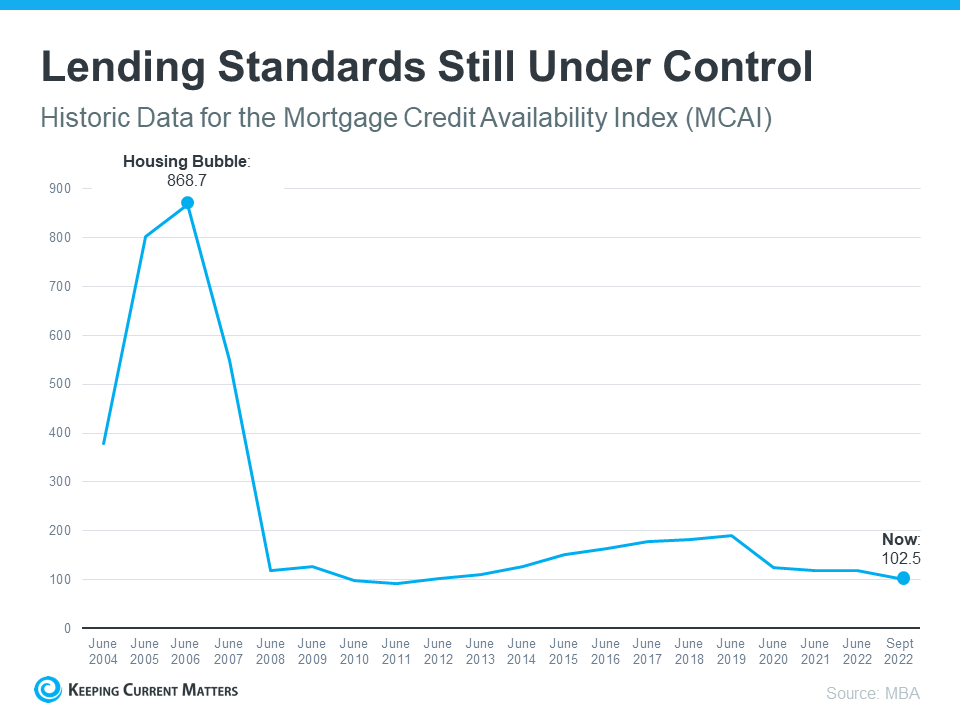
The graph below uses Mortgage Credit Availability Index (MCAI) data from the Mortgage Bankers Association (MBA) to help tell this story. In that index, the higher the number, the easier it is to get a mortgage. The lower the number, the harder it is. In the latest report, the index fell by 5.4%, indicating standards are tightening.
This graph also shows just how different things are today compared to the spike in credit availability leading up to the crash. Tighter lending standards over the past 14 years have helped prevent a scenario that would lead to a wave of foreclosures like the last time.
The Foreclosure Volume Is Nothing Like It Was During the Crash
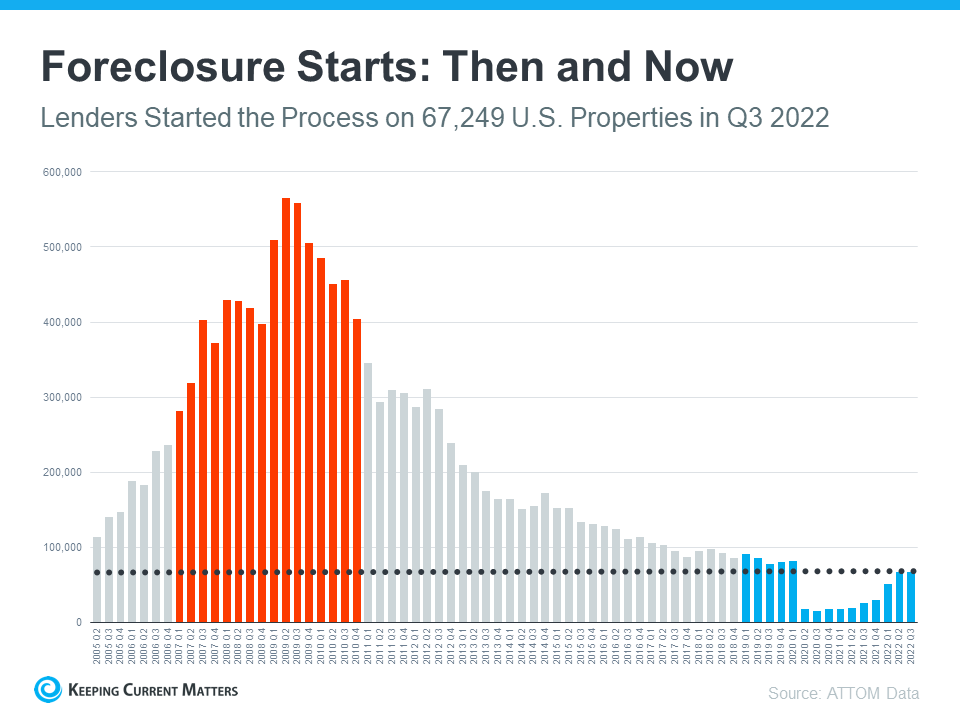
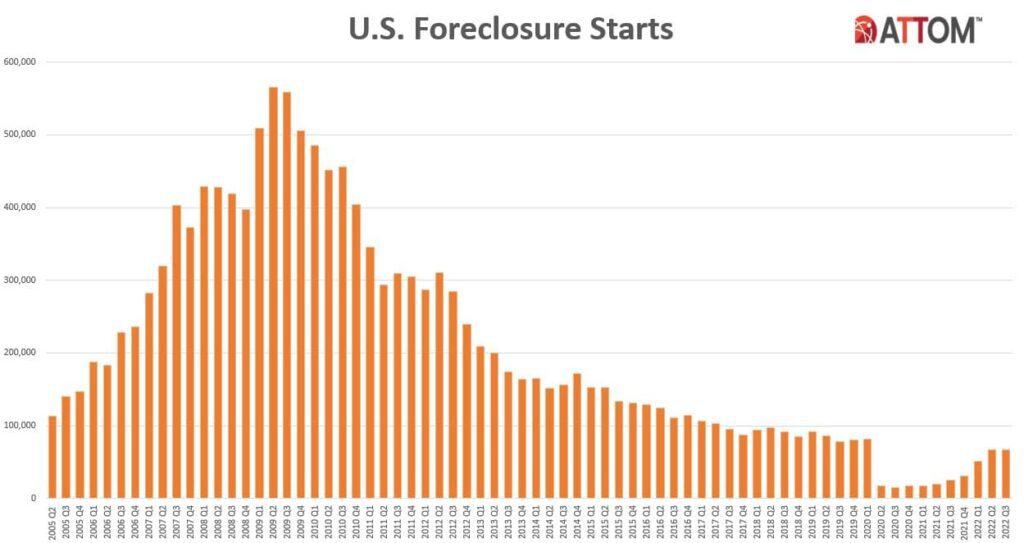
Another difference is the number of homeowners that were facing foreclosure after the housing bubble burst. Foreclosure activity has been lower since the crash, largely because buyers today are more qualified and less likely to default on their loans. The graph below uses data from ATTOM Data Solutions to help paint the picture of how different things are this time:
Not to mention, homeowners today have options they just didn’t have in the housing crisis when so many people owed more on their mortgages than their homes were worth. Today, many homeowners are equity rich. That equity comes, in large part, from the way home prices have appreciated over time. According to CoreLogic:
“The total average equity per borrower has now reached almost $300,000, the highest in the data series.”
Rick Sharga, Executive VP of Market Intelligence at ATTOM Data, explains the impact this has:
“Very few of the properties entering the foreclosure process have reverted to the lender at the end of the foreclosure. . . . We believe that this may be an indication that borrowers are leveraging their equity and selling their homes rather than risking the loss of their equity in a foreclosure auction.”
This goes to show homeowners are in a completely different position this time. For those facing challenges today, many have the option to use their equity to sell their house and avoid the foreclosure process.
Bottom Line
If you’re concerned we’re making the same mistakes that led to the housing crash, the graphs above should help alleviate your fears. Concrete data and expert insights clearly show why this is nothing like the last time.

MARKET SHIFT? HERE’S HOW TO THRIVE & NOT JUST SURVIVE
After years of high buyer demand, low mortgage rates, and insane competition, there’s a change happening in real estate, and it’s happening fast.
Rising mortgage rates have many buyers dropping out of the real estate race. Then there are sellers, who are sitting on the sidelines waiting until the market hits peak prices so they can get the most bang for their buck.
If you’re feeling fatigued, frustrated and uncertain about the future, imagine how your clients feel.
But if you don’t evolve into what today’s consumer demands, you will not survive.
Here is the best way you can help buyers and sellers maneuver today’s shifting market.
FIRST OF ALL, DON’T PANIC
The first thing you have to remember is that the market we’ve grown so accustomed to in the past few years has been anything but normal.
Record low inventory and mortgage rates coupled with record high buyer demand and price appreciation turned the real estate market into a feeding frenzy and everyone wanted a piece of the pie.
What we’re seeing today is that the market is merely reaching an inflection point.
We’re also seeing an extraordinary amount of confusion from consumers and agents about what’s happening in real estate and where it’s headed in 2022.
GET IN FRONT OF ALL THE GOSSIP
On any given day, if you type “real estate market news” into a search engine you’re going to get bombarded with conflicting headlines about what’s happening in the market.
And while some of it is local, a lot of what pops up first covers the nation as a whole.
If you really want to help your buyers and sellers make it through the market shift, you have to get in front of the gossip and constantly share the latest insights.
Moreover, you have to explain how those insights reflect your local market and affect them directly.
This is no easy feat. Real estate data can be extremely difficult for the average consumer to digest and even easier to misinterpret (see headlines above as proof of this).
By educating yourself first and foremost on the latest market data and insights, you can then explain what’s really happening in real estate to your clients and have the cold hard facts to back it up. Today’s FHA Rates.
Will the housing market crash?
With all the headlines and talk in the media about the shift in the housing market, you might be thinking this is a housing bubble. It’s only natural for those thoughts to creep in that make you think it could be a repeat of what took place in 2008. But the good news is, there’s concrete data to show why this is nothing like the last time.
There’s Still a Shortage of Homes on the Market Today, Not a Surplus
For historical context, there were too many homes for sale during the housing crisis (many of which were short sales and foreclosures), and that caused prices to fall dramatically. Supply has increased since the start of this year, but there’s still a shortage of inventory available overall, primarily due to almost 15 years of underbuilding homes.
The graph below uses data from the National Association of Realtors (NAR) to show how the months’ supply of homes available now compares to the crash. Today, unsold inventory sits at just a 3.2-months’ supply at the current sales pace, which is significantly lower than the last time. There just isn’t enough inventory on the market for home prices to come crashing down like they did last time, even though some overheated markets may experience slight declines.
My name is Andre Little and I’m here today to share with you three of the most important topics that you definitely want to be right on top of in the housing market today. I’m going to be talking about what’s happening in the current market, why the market won’t crash and the big one that everyone wants to know, what’s ahead for the forecast for the rest of the year. What are the experts saying about the rest of 2022?
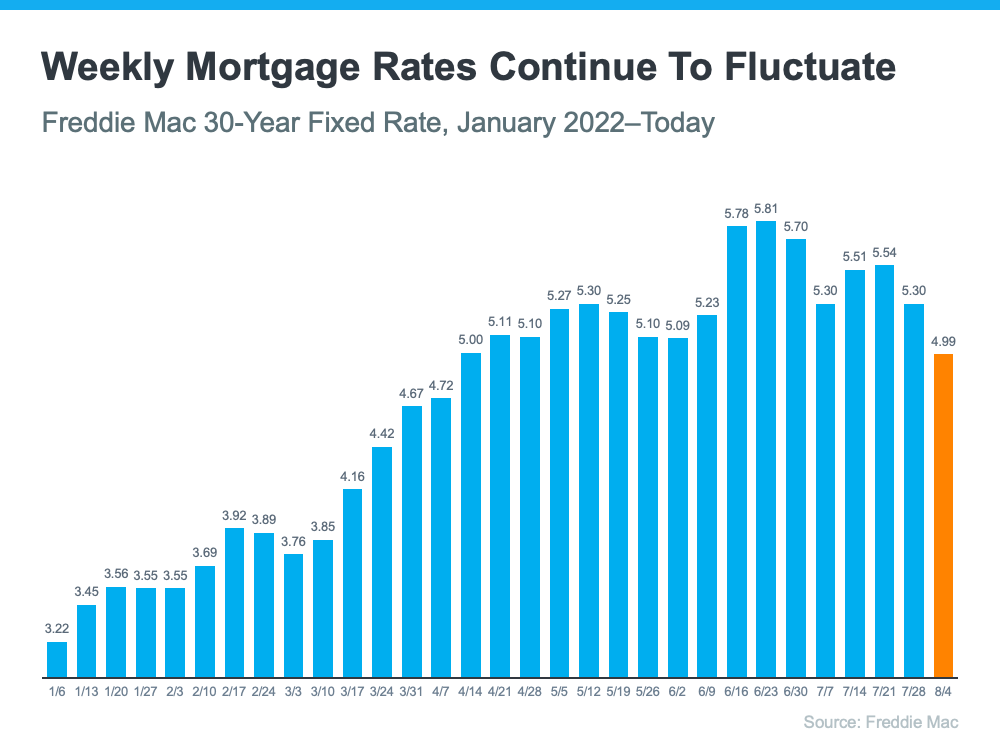
We can probably all agree that this year is really defined by rising mortgage rates, and what you’re looking at here is the Freddie Mac 30-year fixed rate from January all the way through to the latest data we have today, and what we can see over time is that mortgage rates really ticked up week after week after week. And you know they started to potentially peak right around the mid-June end-of-June time, and now we’re seeing a lot of volatility.
So when I say that they’ve peaked, definitely not out of the woods yet, Signs yes, but mortgage rates are showing a lot of volatility right now. Where we are today, a little bit lower than where we were about a month ago, but we’re still watching them. A lot of this has to do with the moves that the Federal Reserve is making to ease inflation. Now we’ve said for a while, if you’ve been following along with us, that inflation is the enemy of long term interest rates, and that’s exactly what the Fed is trying to do. They’re trying to ease inflation, and as that starts to happen, as we saw in the last Federal Reserve meeting, they raised the Federal Funds Rate by 75 basis points. Now when that happens, that doesn’t dictate where mortgage rates go, but it started to signal that maybe the fed is getting inflation under control. Now we’re still watching that for sure but as that starts to happen, the fear of recession comes into the conversation.

Basic economics 101 is that there is not enough supply for the current demand. This will carry us through Q3 and Q4. I will explain in more detail.
Will the housing market crash in 2022
With so many people speculating the housing market forecast asking the question “Will the housing market crash in 2022?” We decided to give real data that is showing that the housing market is still trending towards a sellers market. The contracts to buy U.S. previously owned homes unexpectedly increased in May after declining for six straight months, however higher mortgage rates are cooling demand for housing.
With so many people speculating the housing market forecast asking the question “Will the housing market crash in 2022?” We decided to give real data that is showing that the housing market is still trending towards a sellers market. The contracts to buy U.S. previously owned homes unexpectedly increased in May after declining for six straight months, however higher mortgage rates are cooling demand for housing.
According to the National Association of Realtors (NAR) mentioned on Monday June 27th, 2022 that its Pending Home Sales Index, based on signed contracts, rose 0.7% last month to 99.9, rebounding from a two year low in April. Pending home sales increased in the Northeast and the densely populated South, but fell in the West and Midwest.
Keep in mind that new home sales reversed a four-month slide, even with the impact of high construction costs and surging mortgage rates which have kept many buyers away. New homes remain attractive for would-be buyers, even as the median price of a new home is 15% higher than last year, at $449,000. A total of 696,000 new homes sold during the month, a 10.7% increase from an upwardly-revised March figure, driven by strong double-digit gains in the West and South. However, sales of new homes were 5.9% lower than the same month in 2021.
Housing markets have seen over the past two years of the pandemic record breaking growth. While new homes became highly attractive during earlier COVID days, due to their enhanced functionality and technology, and the significant shortage of existing inventory. Although high prices have been increasingly putting the brakes on transactions, an improvement in the supply pipeline could alleviate the strain on buyers’ budgets.
So, will the housing market crash in 2022? NO, with summer generally being the hottest time for real estate and with us headed into the 3rd Quarter, it’s very unlikely for the housing market to crash in 2022 unless something very catastrophic happens within the next six months. Keep in mind real estate usually has a lag time before it’s affected. And from all my data and information real estate will continue to boom from 2022 and beyond. However, we will see a cooling off in some markets but it won’t be a bubble burst. Some markets will decline in a quarter but year over year the markets will be up. The rise of multiple interest rates by the Federal Reserve has definitely slowed down the values increasing so rapidly.
Housing Market Forecast
Learn how you can benefit by following the pattern of billion dollar real estate hedge funds. Just invest as a Passive Real Estate Investor and this company will do all the active work.
Join Our Investment Community of Passive Real Estate Investors
- Gain access to our Bank Foreclosure Fix & Flips
- Start earning returns that are usually reserved for the ultra wealthy
- We increase your yields by paying you profits on points, interest and equity
- Get started today and earn double digit returns and annualize returns from 36% to 70%
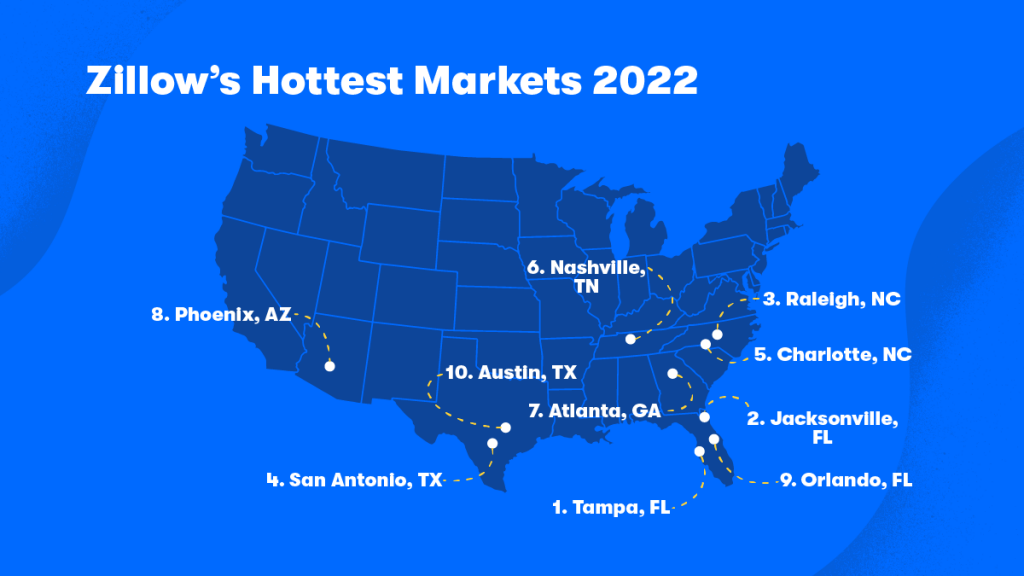
Zillow's Hottest Housing Markets
- Tampa, Florida
- Jacksonville, Florida
- Raleigh, North Carolina
- San Antonio, Texas
- Charlotte, North Carolina
- Nashville, Tennessee
- Atlanta, Georgia
- Phoenix, Arizona
- Orlando, Florida
- Austin, Texas
Housing Market Forecast
The housing market forecast table below lists all states in order of their most recent quarter’s home price appreciation rate (ranked highest to lowest). It is important to note both the relative performance where your state ranked compared to others and the total appreciation over the various time periods. To understand the table below here is an actual example: If you bought a house in the state of Florida for $300,000.00 at the end of the year of 2021 or the very beginning of the year in 2022, your house value in on pace to increase 13.6% annualized, which means the house value would have increase from $300,000.00 to $340,800.00. As you can see real estate is still hot in many markets. There are 5 markets with double digit returns and over 40 states with positive returns in the first quarter based on state data. Keep in mind real estate should be look at based on local data for housing market forecast, not national or even regional data. Get access to low mortgage rates. Loan Trust offer mortgage rates from multiple lenders on one platform saving you time and money without impacting your credit with soft pull credit reports.
Over 83 Loan Programs
Find how you can get approved with NO IMPACT on your Credit Score Today. Click here to Apply Now and get approved fast.
Inflation Adjusted Home Price Appreceiation (%)
Listed below are the housing market appreciation rates. If you would like to invest in real estate click here as a passive real estate investor. Learn how you can begin to invest in Fix & Flips from Bank Real Estate Owned (REO’s) or Foreclosures Now. Visit ROICashFlow.com!
Home Prices Continue Appreciating at Record Rates During the Q2 2022
On a quarterly basis, home prices rose a seasonally adjusted 4.3 percent in Q2 2022. The second quarter from April 1, 2022 through June 30, 2022
“Home prices maintained a near-historic pace of appreciation in the second quarter, as low levels of housing inventory continued to support price growth,” said Doug Duncan, Fannie Mae Senior Vice President and Chief Economist.
Single-family home prices increased at the annualized rate of 19.4 percent in Q2 2022, down slightly from the previous quarter’s upwardly revised 20.5 percent, according to Fannie Mae’s (FNMA/OTCQB) latest Home Price Index (FNM-HPI) reading, a national, repeat-transaction home price index measuring the average, quarterly price change for all single-family properties in the United States, excluding condos.
Hottest Real Estate Markets 2022
Listed below are the hottest real estate markets currently in 2022. This data is what’s being reported at the end of the second quarter of 2022. The hottest market in Q2 was Puerto Rico, but their real estate market is down -0.4% overall for the past year. So I wouldn’t be too excited as a real estate investor over the last year in Puerto Rico, however Florida is the hottest real estate market in 2022 in both of the first two quarters so far. Florida was up 13.6% in Q1 and 11.2% in Q2. More importantly if you invested in Florida a year ago, you would be up 17.7% over the past year.
| # | State Name | Quarter 2 Annualized | Past Year | Past 5 Yrs | Past 10 Yrs |
| 1 | Puerto Rico | 20.7 | -0.4 | 5.4 | -18.1 |
| 2 | Florida | 11.2 | 17.7 | 44.0 | 102.4 |
| 3 | Tennessee | 9.4 | 15.6 | 40.1 | 60.0 |
| 4 | Hawaii | 9.0 | 11.1 | 16.5 | 42.4 |
| 5 | Arizona | 8.5 | 18.9 | 53.5 | 117.9 |
| 6 | North Carolina | 8.3 | 14.2 | 35.8 | 46.3 |
| 7 | Utah | 8.3 | 18.6 | 55.4 | 97.1 |
| 8 | South Carolina | 7.9 | 12.7 | 31.0 | 43.5 |
| 9 | Georgia | 7.8 | 13.8 | 37.5 | 65.9 |
| 10 | Texas | 7.3 | 13.2 | 31.4 | 66.6 |
| 11 | Washington | 7.0 | 13.4 | 44.1 | 91.9 |
| 12 | Montana | 6.8 | 16.6 | 38.5 | 57.4 |
| 13 | Colorado | 6.0 | 12.2 | 34.7 | 88.1 |
| 14 | California | 5.6 | 11.4 | 27.3 | 81.5 |
| 15 | Nevada | 5.4 | 15.1 | 48.6 | 141.5 |
| 16 | Maine | 4.0 | 12.1 | 33.3 | 39.1 |
| 17 | Missouri | 4.0 | 9.1 | 24.6 | 31.8 |
| 18 | USA | 3.6 | 10.1 | 27.2 | 48.6 |
| 19 | Idaho | 3.6 | 18.5 | 75.5 | 119.9 |
| 20 | Oklahoma | 3.4 | 8.3 | 18.0 | 26.5 |
| 21 | South Dakota | 2.5 | 11.6 | 25.5 | 41.3 |
| 22 | Oregon | 2.2 | 10.8 | 31.6 | 81.7 |
| 23 | Kansas | 1.9 | 6.9 | 21.6 | 29.3 |
| 24 | New Jersey | 1.6 | 7.8 | 19.0 | 19.7 |
| 25 | New Mexico | 1.3 | 8.3 | 24.0 | 25.7 |
| 26 | Virginia | 1.2 | 6.5 | 17.8 | 22.7 |
| 27 | New Hampshire | 1.1 | 9.9 | 31.9 | 41.9 |
| 28 | Indiana | 0.9 | 8.9 | 28.6 | 36.2 |
| 29 | Ohio | 0.9 | 7.3 | 25.8 | 33.7 |
| 30 | Maryland | 0.7 | 5.6 | 13.8 | 18.3 |
| 31 | Mississippi | 0.5 | 6.8 | 13.2 | 15.1 |
| 32 | Alabama | 0.5 | 9.1 | 23.8 | 25.0 |
| 33 | Kentucky | 0.3 | 7.4 | 20.8 | 27.3 |
| 34 | Pennsylvania | 0.0 | 6.0 | 19.2 | 22.3 |
| 35 | Alaska | 0.0 | 4.2 | 5.7 | 11.0 |
| 36 | Arkansas | 0.0 | 9.5 | 19.6 | 24.3 |
| 37 | Vermont | -0.2 | 8.6 | 20.5 | 17.6 |
| 38 | Delaware | -0.3 | 7.0 | 17.7 | 18.7 |
| 39 | Wisconsin | -0.4 | 6.9 | 21.1 | 26.4 |
| 40 | Michigan | -0.4 | 7.3 | 26.0 | 56.0 |
| 41 | Louisiana | -0.5 | 2.8 | 7.2 | 13.9 |
| 42 | Illinois | -0.7 | 4.6 | 8.7 | 13.0 |
| 43 | New York | -0.8 | 5.1 | 19.8 | 25.3 |
| 44 | Nebraska | -0.8 | 7.2 | 22.1 | 36.4 |
| 45 | Connecticut | -0.9 | 7.0 | 14.9 | 7.5 |
| 46 | Rhode Island | -0.9 | 9.8 | 29.5 | 38.6 |
| 47 | Massachusetts | -1.0 | 7.1 | 22.7 | 38.2 |
| 48 | Wyoming | -1.7 | 7.9 | 18.6 | 25.2 |
| 49 | Minnesota | -1.7 | 5.9 | 20.5 | 39.3 |
| 50 | Washington DC | -2.6 | 1.5 | 11.8 | 44.5 |
| 51 | Iowa | -2.7 | 4.9 | 11.4 | 18.6 |
| 52 | North Dakota | -4.8 | 1.6 | 1.3 | 26.0 |
| 53 | West Virginia | -4.9 | 3.6 | 9.9 | 11.6 |
Housing Market Forecast 2022
The housing market forecast 2022 is looking promising although the Fed is steading rising interest rates. This strategy the Fed is doing is slightly slowing growth but the inventory is still limited, which is allowing the demand to outweigh the supply. Housing is will continue to grow in the great majority of markets nationwide, however there are some hotter markets than others. This is why we recommend our housing market forecast 2022 for real estate investing. To find the to real estate markets in Florida visit the Florida Real Estate Markets Center.

Join Our Investment Community of Passive Real Estate Investors
- Gain access to our Bank Foreclosure Fix & Flips
- Start earning returns that are usually reserved for the ultra wealthy
- We increase your yields by paying you profits on points, interest and equity
- Get started today and earn double digit returns and annualize returns from 36% to 70%
Learn how you can capitalize with the hottest real estate markets 2022 with our housing market forecast 2022. We grow wealth together by purchasing Bank REO’s as Fix & Flips. We primarily invest in the hottest real estate markets based on housing market forecast metrics.
No. | State Name | Q1 Annualized | Past 1 Year | Past 5 Yrs | Past 10 Yrs |
|---|---|---|---|---|---|
1
| Florida | 13.6 | 16.5 | 41.7 | 91.3 |
2 | Hawaii | 12.5 | 08.6 | 13.6 | 39.0 |
3 | Tennessee | 12.2 | 14.6 | 37.7 | 53.7 |
4 | Georgia | 11.2 | 13.2 | 35.0 | 57.3 |
5 | Arizona | 11.1 | 19.9 | 51.5 | 110.6 |
6 | Montana | 09.7 | 16.8 | 37.8 | 54.4 |
7 | South Carolina | 09.4 | 11.4 | 29.1 | 37.3 |
8 | Arkansas | 09.2 | 10.0 | 20.2 | 23.2 |
9 | North Carolina | 09.2 | 12.9 | 32.7 | 40.1 |
10 | Nevada | 08.3 | 15.9 | 47.8 | 134.1 |
11 | Texas | 07.8 | 12.2 | 30.0 | 62.3 |
12 | California | 07.6 | 11.4 | 26.1 | 75.7 |
13 | South Dakota | 06.8 | 10.9 | 25.0 | 39.3 |
14 | Alabama | 06.7 | 09.5 | 23.4 | 22.5 |
15 | Utah | 06.2 | 19.3 | 54.1 | 91.2 |
16 | Wyoming | 05.6 | 08.5 | 17.9 | 25.1 |
17 | New Mexico | 05.5 | 09.6 | 22.5 | 22.4 |
18 | Idaho | 05.2 | 22.2 | 76.2 | 114.4 |
19 | USA | 04.8 | 10.2 | 26.3 | 44.7 |
20 | Washington | 04.6 | 13.2 | 43.4 | 84.2 |
21 | Delaware | 04.5 | 08.9 | 16.9 | 17.1 |
22 | Indiana | 04.0 | 09.3 | 27.8 | 33.6 |
23 | Kentucky | 03.9 | 07.9 | 21.3 | 26.3 |
24 | New Jersey | 03.9 | 08.5 | 16.6 | 16.7 |
25 | Mississippi | 03.7 | 06.7 | 12.3 | 13.1 |
26 | Maine | 03.6 | 12.8 | 32.3 | 35.3 |
27 | Oklahoma | 03.2 | 08.0 | 17.8 | 24.6 |
28 | New Hampshire | 02.8 | 11.2 | 31.6 | 38.5 |
29 | Rhode Island | 02.7 | 11.4 | 29.7 | 35.8 |
30 | Vermont | 02.7 | 09.9 | 20.3 | 16.4 |
31 | West Virginia | 02.6 | 05.5 | 09.4 | 11.4 |
32 | Missouri | 02.4 | 08.5 | 23.2 | 28.4 |
33 | Colorado | 02.3 | 12.0 | 34.2 | 83.0 |
34 | Oregon | 01.7 | 12.3 | 31.5 | 76.2 |
35 | Illinois | 0.07 | 04.6 | 07.9 | 11.0 |
36 | Ohio | 0.07 | 07.6 | 25.5 | 31.0 |
37 | Virginia | 0.06 | 06.8 | 16.6 | 20.0 |
38 | New York | 0.05 | 06.5 | 19.9 | 23.9 |
39 | Massachusetts | 0.04 | 08.2 | 23.0 | 36.7 |
40 | Michigan | 0.00 | 08.2 | 27.0 | 52.1 |
41 | Louisiana | 0.00 | 02.6 | 06.2 | 12.6 |
42 | Maryland | -0.10 | 06.3 | 12.4 | 15.5 |
43 | Pennsylvania | -0.20 | 07.0 | 18.8 | 20.4 |
44 | Wisconsin | -0.20 | 0.70 | 21.7 | 24.5 |
45 | Iowa | -0.50 | 05.3 | 12.4 | 18.6 |
46 | North Dakota | -0.50 | 01.5 | 02.5 | 27.6 |
47 | Connecticut | -06.0 | 08.5 | 13.0 | 05.2 |
48 | Nebraska | -0.80 | 07.7 | 23.1 | 35.4 |
49 | Minnesota | -1.90 | 06.6 | 21.6 | 36.4 |
50 | Kansas | -1.90 | 06.8 | 20.1 | 26.8 |
51 | Alaska | -3.00 | 03.7 | 05.8 | 09.6 |
52 | District of Columbia | -5.00 | 01.6 | 11.4 | 45.2 |
53 | Puerto Rico | -15.8 | -6.30 | 03.4 | -20.2 |
Housing Market Crash
Many people around the world are wondering when will the housing market crash take place and is it all ready happening. The world economy already is contending with soaring inflation, and stock market bears in the midst of a war impacting the world. So one of the biggest concerns isn’t just, “Is the housing market going to crash?”, but “When will the housing market crash?”
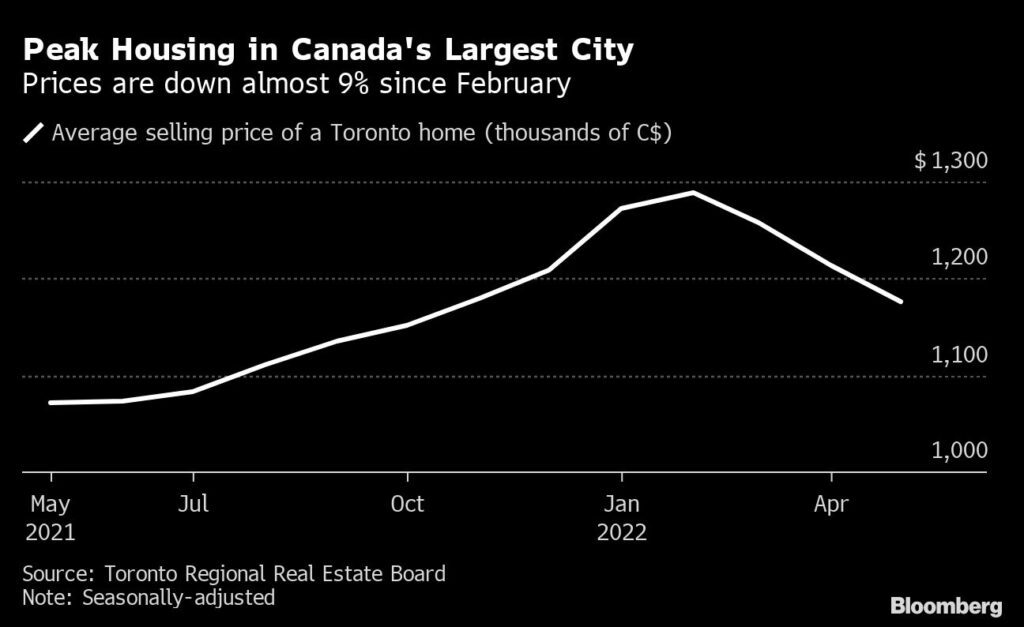
The soaring borrowing cost and the rapidly increasing of interest rates around the globe from central banks have people who were already stretching to buy property reaching their limits. The impact of this isn’t just in the US but also in New Zealand and Canada. All of these were markets were at one time hot residential real estate markets and some have started to cool off more rapid than others.
“Very Fast rapid deterioration in affordability and large drops in home sales suggest that a hard landing is a meaningful risk, especially in New Zealand, Australia and Canada, although that is not our baseline given current tightness,” the Goldman economists wrote.
Central banks are issuing warnings of their own. The Bank of Canada said this month in its annual review of the financial system that high levels of mortgage debt are of particular concern as interest rates rise and more borrowers are strained to pay bills. The Reserve Bank of New Zealand’s semi-annual Financial Stability Report said that the overall threat to the financial system is limited, but a “sharp” decline in house prices is possible, which could significantly reduce wealth and lead to a contraction in consumer spending.
“As borrowing costs rise, real estate markets face a critical test,” Bloomberg’s Shah said. “If central bankers act too aggressively, they could sow the seeds of the next crisis.”
Be aware, the risk of a sharp drop in prices is clearly greater when there’s a synchronized global tightening of monetary policy, said Niraj Shah of Bloomberg Economics in London. More than 50 central banks have raised interest rates by at least 50 basis points in one go this year, with more hikes expected. In the US, the Federal Reserve last week boosted its main interest rate by 75 basis points, its biggest increase since 1994.
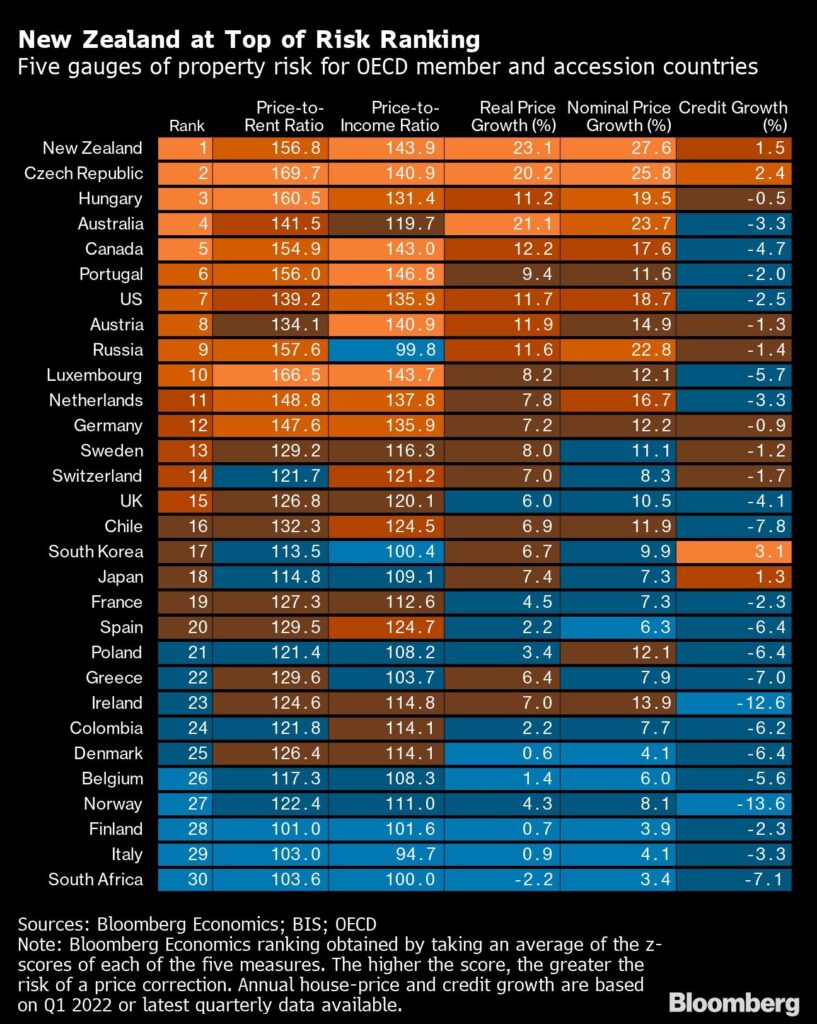
Housing markets in New Zealand, the Czech Republic, Australia and Canada rank among the world’s bubbliest and are particularly vulnerable to falling prices, according to Bloomberg Economics. Portugal is especially at risk in the euro area, while Austria, Germany and the Netherlands also are looking frothy.
In Asia, South Korea house prices also look vulnerable, according to an analysis by S&P Global Ratings. That report noted risks from household credit relative to nominal GDP, the growth rate of household debt and the speed of house-price gains. Elsewhere in Europe, Sweden has seen a dramatic turnaround in housing demand, sparking concern in a country where debt runs at 200 per cent of household income.
Goldman Sachs Group Inc. economists wrote in a report last week that the signals from home sales typically precede prices by about six months, indicating that several countries are likely to see further declines in values. A substantial cooldown in housing markets is an important reason why developed economies will likely slow, according to the economists led by Jan Hatzius.
Housing Market
The housing market and housing market forecast are out for the second quarter for 2022. Currently, 151 markets (37% of all U.S. real estate) experienced ‘real’ (inflation adjusted) declines in property values compared to the prior Quarter. This might be the best time for you to invest in a self directed IRA real estate plan for retirement.
For the same period last year 93 markets (22.9%) saw Q-O-Q declines.
Note: Because of seasonal variations between quarters, it’s best to compare Q-O-Q changes to the ‘year ago’ period rather than the immediately preceding quarter.
While many US housing markets saw continued crazy-strong appreciation on a year-over-year basis, when you look at only the most recent quarter-over-quarter results, a different story starts to emerge.
As you can see in the list below, many metro housing markets failed to keep pace with inflation on a 3-month basis. This could be an early ‘tell’ for those markets.
Granted, inflation was very high and a single quarter’s results do NOT make a trend, The year-over-year results point to very strong appreciation, even after adjusting for inflation.
This is the most volatile (and exciting) time for real estate markets I’ve ever seen.
Fortunes will be made or lost in the coming quarters; some markets will do amazingly well; others will crash and burn.
How to Inspect Real Estate Out of State Without Breaking the Bank
With the real estate market changing so rapidly due to inflation many real estate investors are seeking markets outside of their local areas due to economic uncertainty. Many real estate investors are traveling to out of state markets to find better real estate investments. To get discounts on travel or use a travel concierge to find the best deals.
The top real estate markets are spread out all over the country with three in Florida, two in North Carolina, two in Texas, one in Georgia, one in Arizona and one in Tennessee. Find the best cities in Florida Real Estate Investing.


